FUNDAMENTAL ANALYSIS WITH INVESTMENT ACCOUNT MANAGER
Fundamental ratio analysis is an investment approach that focuses on specific relationships, or ratios, of the financial data of a company. This method offers a "snap shot" of a company's value, where the analysis is a review of a firm's financial report. Recognizing the importance of these relationships and ratios, the Investment Account Manager provides the investor with a comprehensive set of variables that can be used to derive informative ratios that may be helpful in discovering undervalued securities.
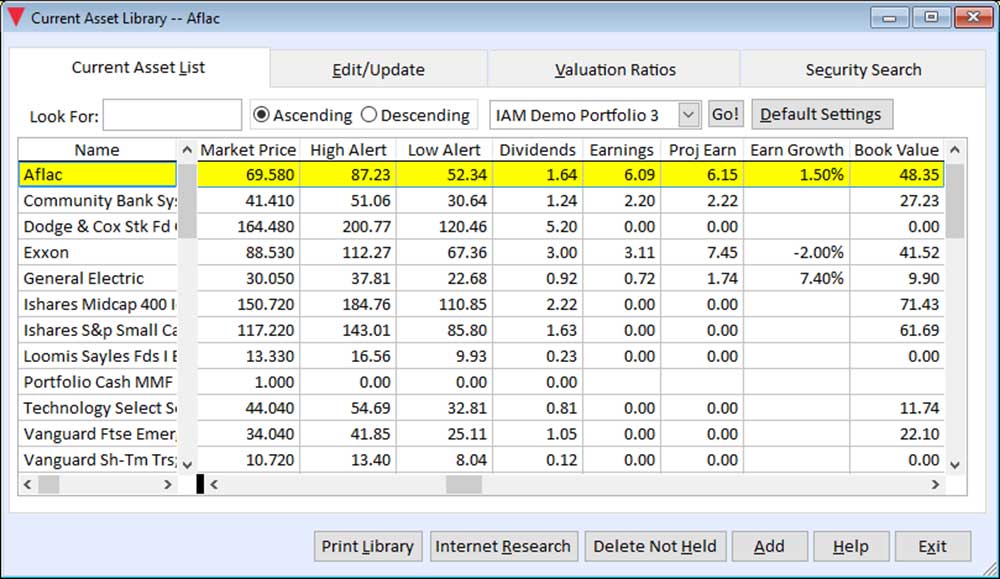
If using one of the data subscription services (QuoteMedia Data Service) the required data can be automatically downloaded. If not, fundamental data can also be manually entered into IAM. Regardless, prior to using the valuation ratios provided by Investment Account Manager, you'll want to be certain you've updated your Current Asset Library asset library to reflect up to date data.
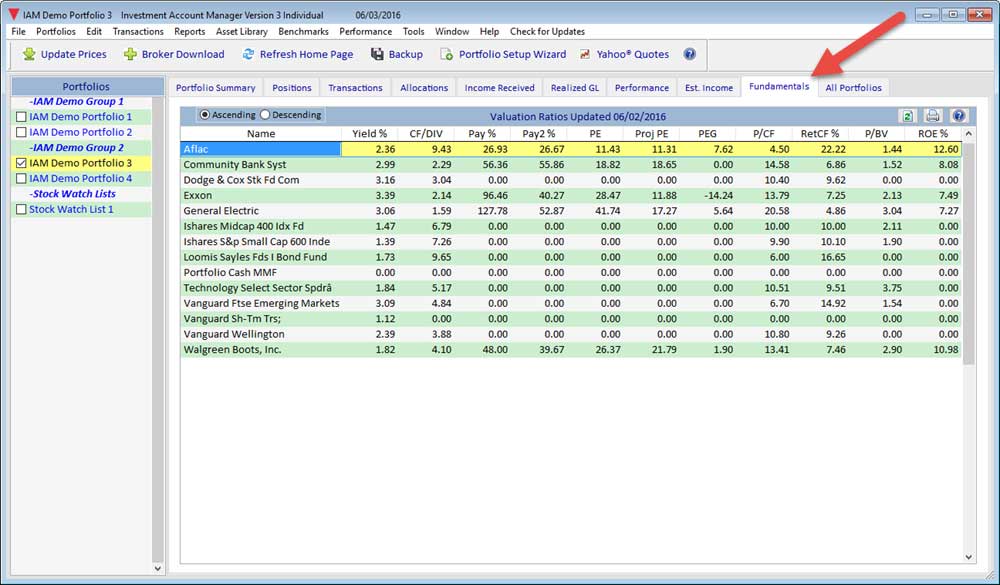
The following fundamental ratios will be derived using the data in the Current Asset Library: These ratios are displayed on the Asset Library Menu | Current Asset library | Valuation Ratios tab. Additionally, the Fundamentals tab found on IAM's Home Page which also displays this information for the open portfolio.
Investment Account Manager will find valuable fundamental analysis information on the programs many different reports including:
- Portfolio weighted average P/E ratio
- Portfolio weighted average Beta
- Portfolio and individual current yield
- Individual security yield on cost
- Mutual fund and ETF objectives
FUNDAMENTAL ANALYSIS USING VALUATION RATIOS
- Current Yield %: if you are an investor seeking income as well as growth, current yield will indicate if the company is paying a dividend, and if the rate of payment is sufficient to meet your requirements. Current yield is calculated by the current dividend per share divided by current market price. Dividend yield is a useful measurement that can be compared to the yield on alternative investments i.e., T-Bills, Money Market Funds, Stocks, etc.) in order to select investments based on their ability to generate investment income. The dividend yield can provide an indication of the safety of the dividend. For example, a higher dividend yield may indicate that the market anticipates lower earnings and a subsequent dividend cut, and this expectation has resulted in a lower market price.
- Cash Flow/Current Dividend: The cash flow/current dividend relationship is important because at times, for any number of reasons, a company may not be "earning" their yearly dividend. Investors worried about the sustainability of the dividend should be concerned if the cash flow per share covers the dividend. This is because dividends (and the earning power of a company) are really dependent on the cash flow generated by a firm. The larger the value produced by the ratio, the more secure the dividend.
- Dividend Payout Ratio %: this ratio shows what percentage a company is paying out its earnings (current dividends per share divided by current earnings per share. In general, the lower the number, the more secure the dividend. When the current payout ratio is below historical norms, a company will often times gradually increase the rate of dividend growth (resulting in a faster rising current dividend rate) in an effort to get back on track with their history. Likewise, if the current payout ratio is higher than historical norms, a company will gradually decrease the rate of dividend growth (resulting in a slower rising current dividend rate) in an effort to reduce the payout ratio to historical levels.
- Dividend Payout Ratio % 2: this ratio shows an estimate of the forward-looking company payout (current dividends per share divided by projected earnings per share). Comparing the current payout ratio to the projected payout ratio can provide insight into the security of the dividend rate, the expected growth of the dividend rate, as well as the direction of earnings per share.
-
Price/Earnings (P/E): perhaps the most frequently used ratio to judge the degree of valuation for a security, P/E is simply current market price divided current earnings per share. Some general guidelines in the use of the P/E ratio include:
- The future level of the P/E ratio can be viewed as a function of the current P/E ratio or an average P/E ratio over some period of time.
- The P/E ratio is a function of future expected earnings. The higher the growth rate of earnings expected, the higher the current P/E ratio. An investor will be willing to pay a higher price for a dollar of current earnings if earnings are expected to grow at a much higher rate in the future.
- P/E ratios can change radically and suddenly because of a change in the expected growth rate of earnings. Therefore, the greater the expected stability in the growth rate of earnings per share, the higher the P/E.
- P/E ratios tend to be inversely correlated with inflation.
- High interest rates tend to reduce P/E ratios.
- The higher the P/E ratio relative to the market, the higher the risk.
- P/E ratios vary by industry.
- Companies with a large portion of debt in the capital structure tend to have lower P/E ratios.
- Projected P/E: Projected P/E is simply current market price divided by projected earnings per share. Look for the projected P/E ratio to be less than the current P/E ratio. If the projected P/E is lower, it must be due to higher projected earnings for the stock, a desired condition. If the projected P/E is higher, it must be due to lower projected earnings for the stock, a negative condition. Be sure to compare the projected P/E with the average P/E of past years for an indication of future performance.
- PEG Ratio: one of the "Famous Numbers" from Peter Lynch's book One Up On Wall Street4, this relationship compares earnings growth with the price/earnings ratio, the principle being that the market values a stock so that it sells at a price that reflects its earnings potential. The PEG ratio is derived by the Current P/E Ratio ÷ Projected Earnings Growth %. The higher the expected growth rate of earnings, the higher the current P/E ratio ought to be. In general, the P/E ratio of a company that is fairly priced will equal its growth rate. If the P/E ratio is less than the growth rate, the PEG value will be less than 1.0, suggesting a possible bargain; if the P/E ratio is greater than the growth rate, the PEG value will be greater than 1.0, suggesting a premium is being paid for the security. If the PEG ratio is above 1.5, the security may be vulnerable to a sharp drop in price if earnings per share growth departs from investor's expectations.
- Market Price/Cash Flow per Share & Return on Cash Flow %: Market price/cash flow per share gives an indication of what ratio a stock is trading at in relation to the cash flow being generated from operations after all cash expenses have been subtracted. To better understand this ratio, the inverse of the ratio can be used to derive the return on cash flow.6 For example, a $10 stock with $1 per share in annual cash flow has a 10-to-1 ratio. The inverse of this 10-to-1 ratio, 10 percent, closely matches the ten percent that an investor expects to receive for owning stocks long term. A $20 stock with a $4 per share cash flow gives a 20 percent return on cash. Look for companies that, given a high sustainable cash flow per share (preferably free cash flow per share), result in an attractive return on cash flow percent.
- Market Price/Book Value per Share: the market price/book value ratio gives an idea of how a security is trading in relation to its book value. A low relative market price to book value ratio usually suggests that the company is undervalued. This is because a company's book value represents, all else being equal, the value at which a firm always has the option to liquidate, or sell-off of its assets. A low market-to-book value ratio is seen as providing a "margin of safety" and in some cases, is considered the "floor" supporting the market price. However, it should be noted that as some companies adopt more creative accounting policies and/or as the rules of FASB (Federal Accounting Standards Board) change, the resulting book value may not accurately reflect the market values of assets. Also, the productivity of assets, the combination of assets and entrepreneurial ability often create greater earnings and greater values than the book value of the assets suggests. When considering book value, use a reliable source that provides a good understanding of market values of assets.
- Return On Equity: this value shows how much is being earned each year by the company, where the higher the percent returned, the better for the investor (note: a high debt level can also increase ROE, however the return will be riskier). Return on equity is computed by dividing earnings per share by book value per share. As a growth investor, you want to see steady or rising return on equity.
- Up/Down: One of NAIC's classic measure of risk for a stock is it's upside-downside ratio (U/D), a measure of how much gain might be expected if things go right, compared to how much could be lost if things go wrong. BetterInvesting encourages investors to make sure stocks held in a portfolio have at least a 2-to-1 U/D ratio; 3-to-1 if the company is being considered for purchase.
In summary, valuation ratios provide important insights into the financial strength of a company. In the case of dividend ratios, investors can identify the current fortunes of a company, while determining investment suitability on an individual basis. While there are strong arguments both in favor of dividend-paying stocks (such as providing a price-floor based on yield) and non dividend-paying stocks (such as the ability to grow faster since all earnings are being plowed back into itself), investors should serious consider the many benefits of diversifying across a variety of stocks by sector as well as by varying degrees of dividend policies. Additionally, when investing in dividend paying stocks, keep an eye on the future. It is expectations of future dividends (and earnings and cash flows to support future dividends) that offer a clue on future stock price performance. In the case of earnings-based ratios, these too provide useful measurements. However, in the case of earnings, many outside factors can creep into "accounting earnings" that may or may not result in a reliable estimate of "economic earnings". The important point, then, is to be confident in the data source(s) you're using for your earnings estimates; simply stated... garbage in — garbage out.
SORTING FUNDAMENTAL DATA
Within IAM users can sort the fundamental analysis data, ascending or descending, by any column of data. Simply move your mouse pointer to the header of the column. You will the appearance will change to an arrow. Double click to sort.
Here we have sorted on dividend yield, highest to lowest:
- Free Cash Flow: AAII Journal, Common Stock Analysis: Examining Cash Flow, May 1990. Formula Reprint: AAII, March/April 1991, pg. 5.
- Dividends Count: Screening for Undervalued Stocks with Lower Risk: AAII Journal, Stock Screening, October 2002, pg. 13.
- Guidelines in the Use of the P/E Ratio: Investments, An Introduction to Analysis and Management, Frederick Amling, Prentice Hall, pg. 527.
- Current P/E Ratio ÷ EPS Growth Rate: One Up On Wall Street, Peter Lynch, Penquin Books, 1989, pg. 198.
- Repair Shop: Better Investing, October 2001, pg. 16.
- Return on Cash Flow: One Up On Wall Street, Peter Lynch, Penquin Books, 1989, pg. 214.